For distributed training and cloud infrastructure engineers
Separate provider infrastructure faults from distributed training bugs.
Each GPU cloud exposes different networking fabrics, container overlays, and virtualization boundaries. Preserve the exact log evidence needed before retrying a failed run or escalating a support ticket.
Free 30-day Team evaluation. No card or automatic subscription. Work email verification required.
Replay a resolved multi-node cluster incident
Upload your log file. Review the selected evidence and masking, then run diagnosis. Keep the original log for any follow-up questions.
Before uploading, review cloud data handling and local options.
Upload your log file. Large files are processed in your browser. Only selected evidence is submitted when you run diagnosis.
Try Denpex for 30 days. FREE.
No credit card. No automatic subscription. See whether Denpex helps with an incident you already understand.
Start your free 30-day Team evaluation
Up to 50 diagnoses a day for 30 days. Verify your work email to activate an eligible company evaluation, then replay a resolved incident and compare the evidence and next steps with your team's confirmed cause.
What a useful evaluation should establish
Isolate the single failing node or interface without tearing down healthy cluster resources or blaming collateral timeout victims.
Use Denpex alongside your existing telemetry tools to investigate submitted incident evidence. With monitoring configured on a supported plan, detected failures can trigger alerts and an automatic diagnosis from the captured evidence.
Inside Denpex
See the evidence, not just the claim
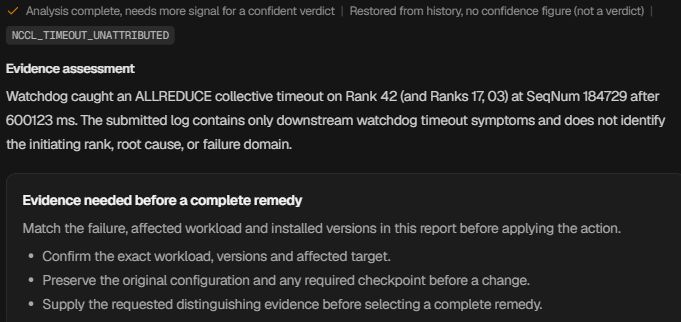
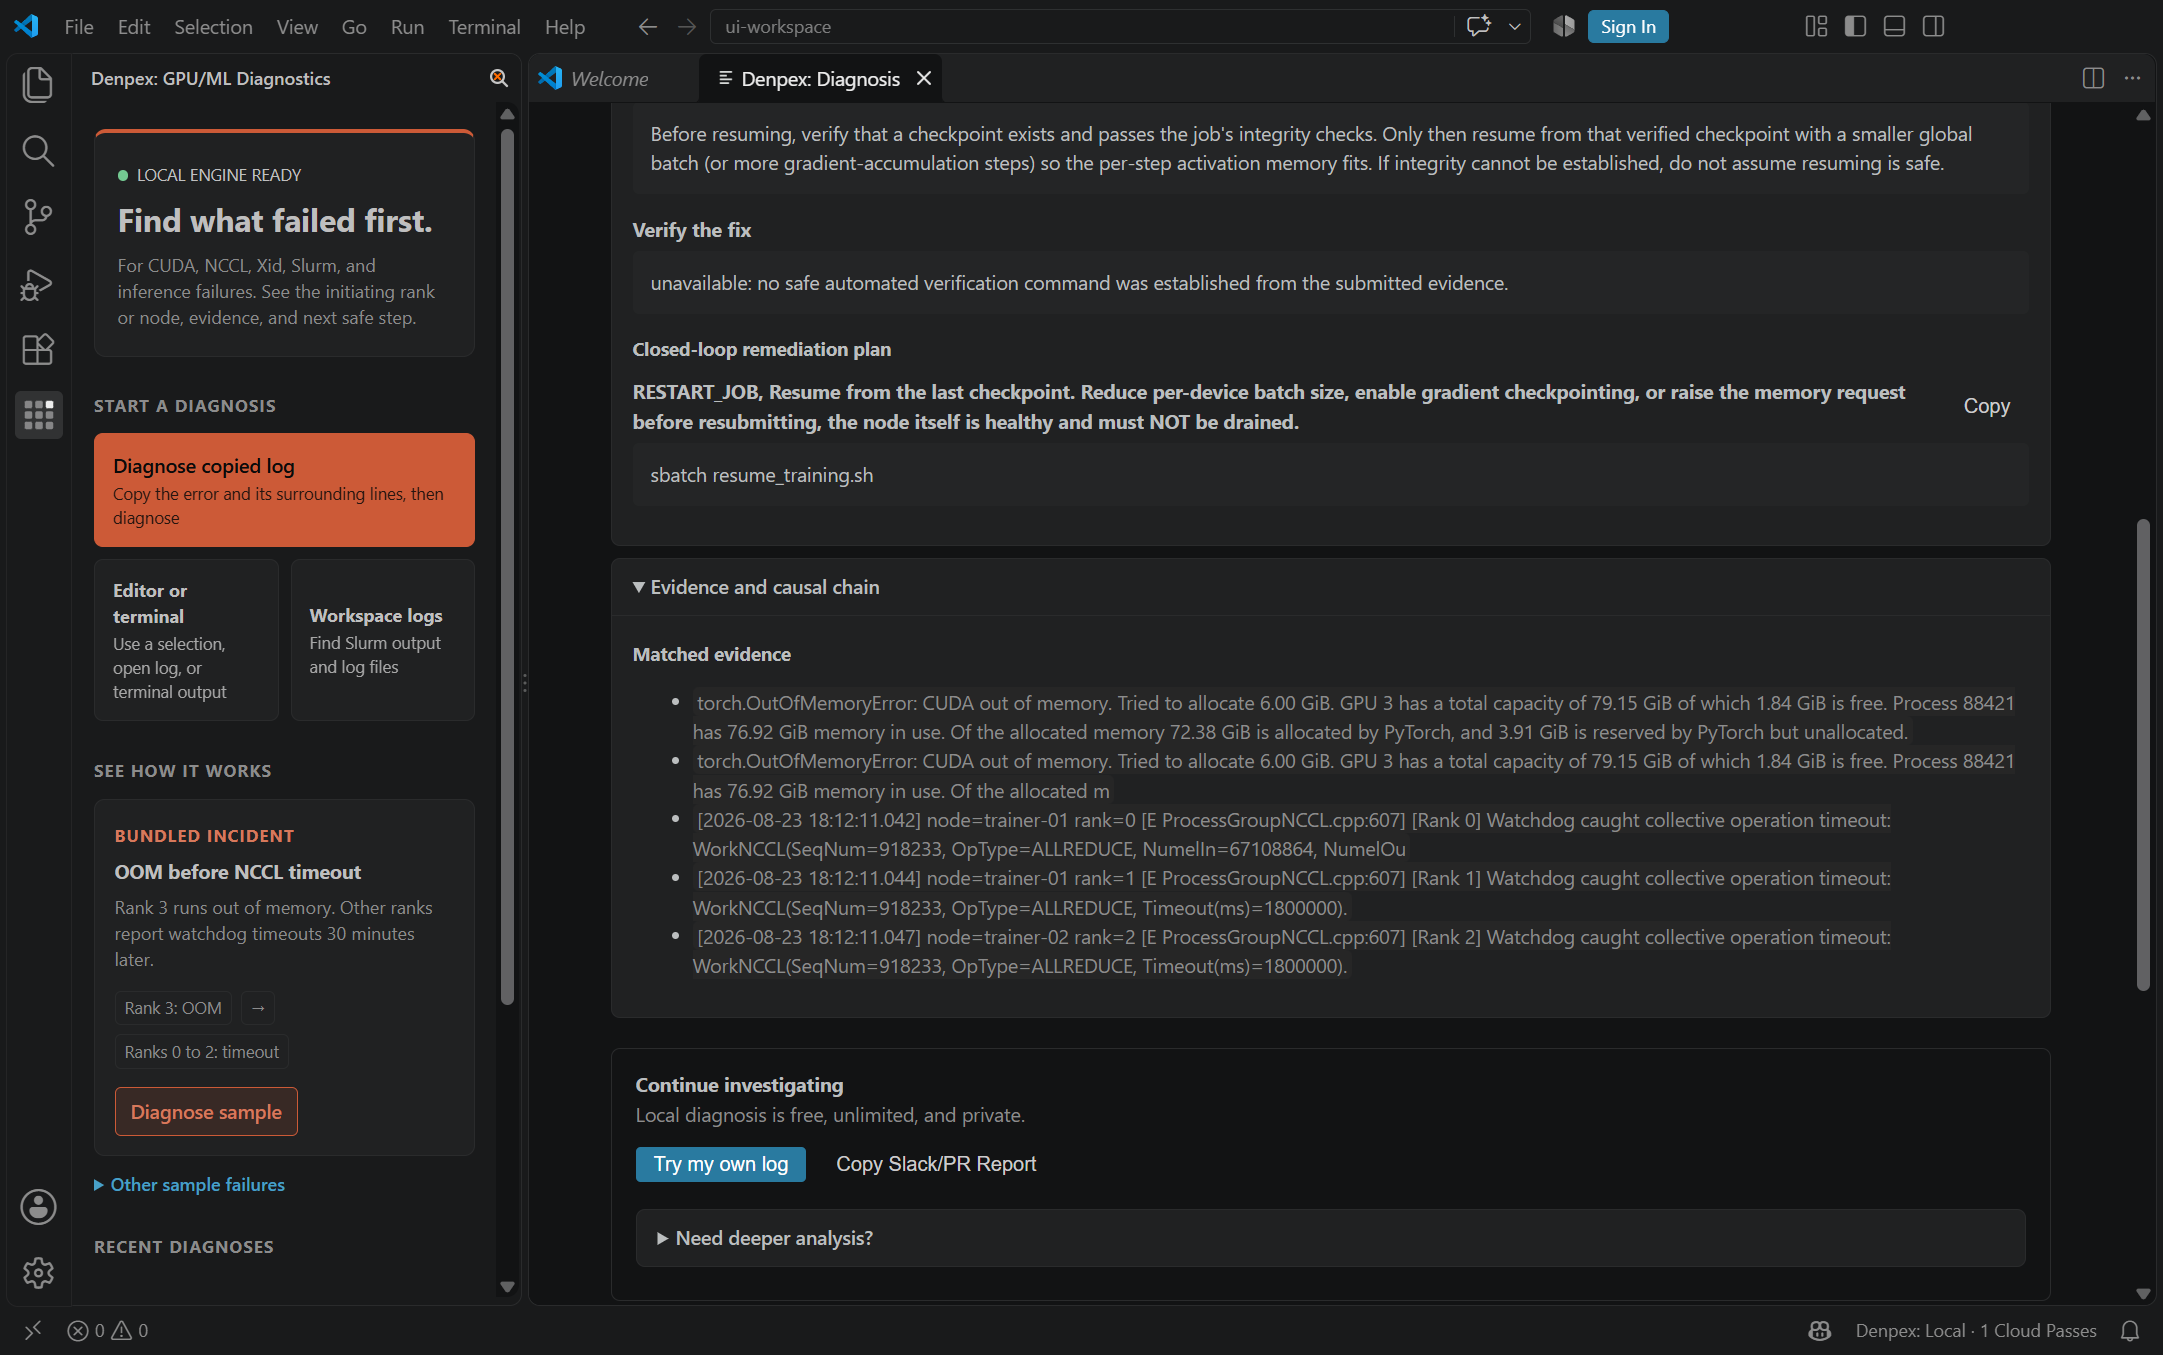
Follow the causal chain, inspect the quoted evidence and prepare the next handoff. These actual product captures use founder-account examples and the VS Code extension, with the source identified under each image. Open a capture to inspect it at full size.
Follow the failure through the cascade
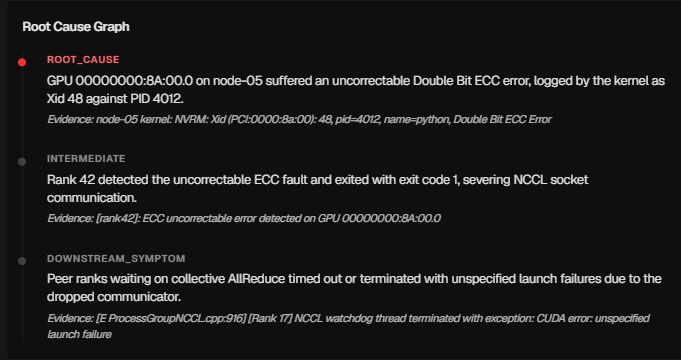
Prepare the hardware escalation

Ask for the evidence that is missing
Keep the investigation in the editor
Available Cloud Provider Failure Triage Workflows
Select your GPU cloud provider to review failure signatures, terminal tracebacks, and verification environment flags.
Separate container socket misrouting from a true worker stall on RunPod.
Keep container network interface bindings, Pod or Instant Cluster lifecycle logs, and rank-0 rendezvous traces beside the first ProcessGroupNCCL watchdog exception.
NCCL_DEBUG=INFONCCL_SOCKET_IFNAME=eth0Distinguish an InfiniBand mlx5 fabric flap from an application rank stall on Lambda.
Correlate Mellanox RDMA transport retry counters, NVSwitch health telemetry, and rank-level Python tracebacks to isolate which 8x H100 node triggered the collective abort.
NCCL_DEBUG=INFONCCL_DEBUG_SUBSYS=INIT,NETIsolate motherboard PCIe P2P restrictions and /dev/shm limits on Vast.ai hosts.
Verify IOMMU peer-to-peer memory access, Docker shared memory allocation, and spot instance preemption markers before blaming model code on heterogeneous Vast.ai rigs.
NCCL_P2P_DISABLE=1NCCL_SHM_DISABLE=0Separate RoCE v2 GID routing mismatches from DeepSpeed ZeRO-3 stage stalls on Scaleway.
Preserve NCCL RoCE Global Identifier (GID) table selections, Priority Flow Control (PFC) indicators, and DeepSpeed parameter partitioning logs when multi-node jobs freeze.
NCCL_DEBUG=INFONCCL_IB_GID_INDEX=3Link Kubernetes pod restarts directly to underlying Xid 79 or NVLink hardware faults.
Align Kubelet eviction events, DCGM health exporter alerts, and kernel Xid codes so your team knows whether to reschedule onto a healthy node or debug container OOMs.
NCCL_DEBUG=INFOTORCH_NCCL_ASYNC_ERROR_HANDLING=1Pinpoint which straggler rank or RoCE link slowed down your Crusoe Cloud cluster.
Compare per-rank step completion drift, shared storage checkpoint durations, and RDMA pause frames before a slow worker trips the global NCCL watchdog.
NCCL_DEBUG=INFOTORCH_NCCL_ENABLE_MONITORING=1Fix vSwitch MTU fragmentation and NCCL socket discovery on Hetzner bare metal.
Separate VLAN vSwitch jumbo frame drops, asymmetric NIC binding, and unconfigured RDMA probes when connecting multi-node GPU servers on Hetzner.
NCCL_IB_DISABLE=1NCCL_SOCKET_IFNAME=enp7s0.4000Untangle NAT port forwarding and c10d rendezvous timeouts on TensorDock VMs.
Verify whether torchrun workers failed during initial TCPStore handshake, ephemeral port negotiation, or KVM hypervisor PCIe passthrough resets.
NCCL_DEBUG=INFONCCL_SOCKET_IFNAME=wg0さくら高火力サービスにおけるH100 NDR/RoCE NCCLタイムアウトの自動診断
Mellanox ConnectX-7アダプタのQP枯渇、ノード間テナント接続の不整合、および16bit学習時のPCIe AER内部エラーを特定します。
NCCL_DEBUG=INFONCCL_IB_HCA=mlx5GPUSOROBANにおける多重GPU P2P通信ストールとPCIeトポロジ競合の解決
物理NUMAソケット配置に対するCUDA_VISIBLE_DEVICESの不整合やコンテナランタイムの共有メモリ/dev/shm容量不足を即時に検出します。
NCCL_P2P_DISABLE=1NCCL_DEBUG=INFO네이버 클라우드 GPU 인스턴스 DDP 랑데부 멈춤 및 VPC MTU 병목 진단
기본 MTU 제한으로 인한 VPC 서브넷 패킷 단편화, 비공개 보조 인터페이스 바인딩 실패, torchrun 마스터 주소 해석 오류를 명확히 분리합니다.
NCCL_SOCKET_IFNAME=eth0NCCL_IB_DISABLE=1TWCC 台灣智慧雲 GPU 叢集 Xid 79 PCIe 掉卡與 Slurm 任務卡死自動診斷
精確區分 Slurm 節點被排程管理器取消、單卡散熱降頻導致的全叢集拖後腿,以及 PCIe 匯流排掉卡 (Xid 79) 硬體故障。
NCCL_DEBUG=INFOTORCH_NCCL_ASYNC_ERROR_HANDLING=1