Denpex vs Prometheus / Grafana
Prometheus shows you that something broke. Denpex tells you what broke and why. Different halves of the same incident.
Inside Denpex
See the evidence, not just the claim
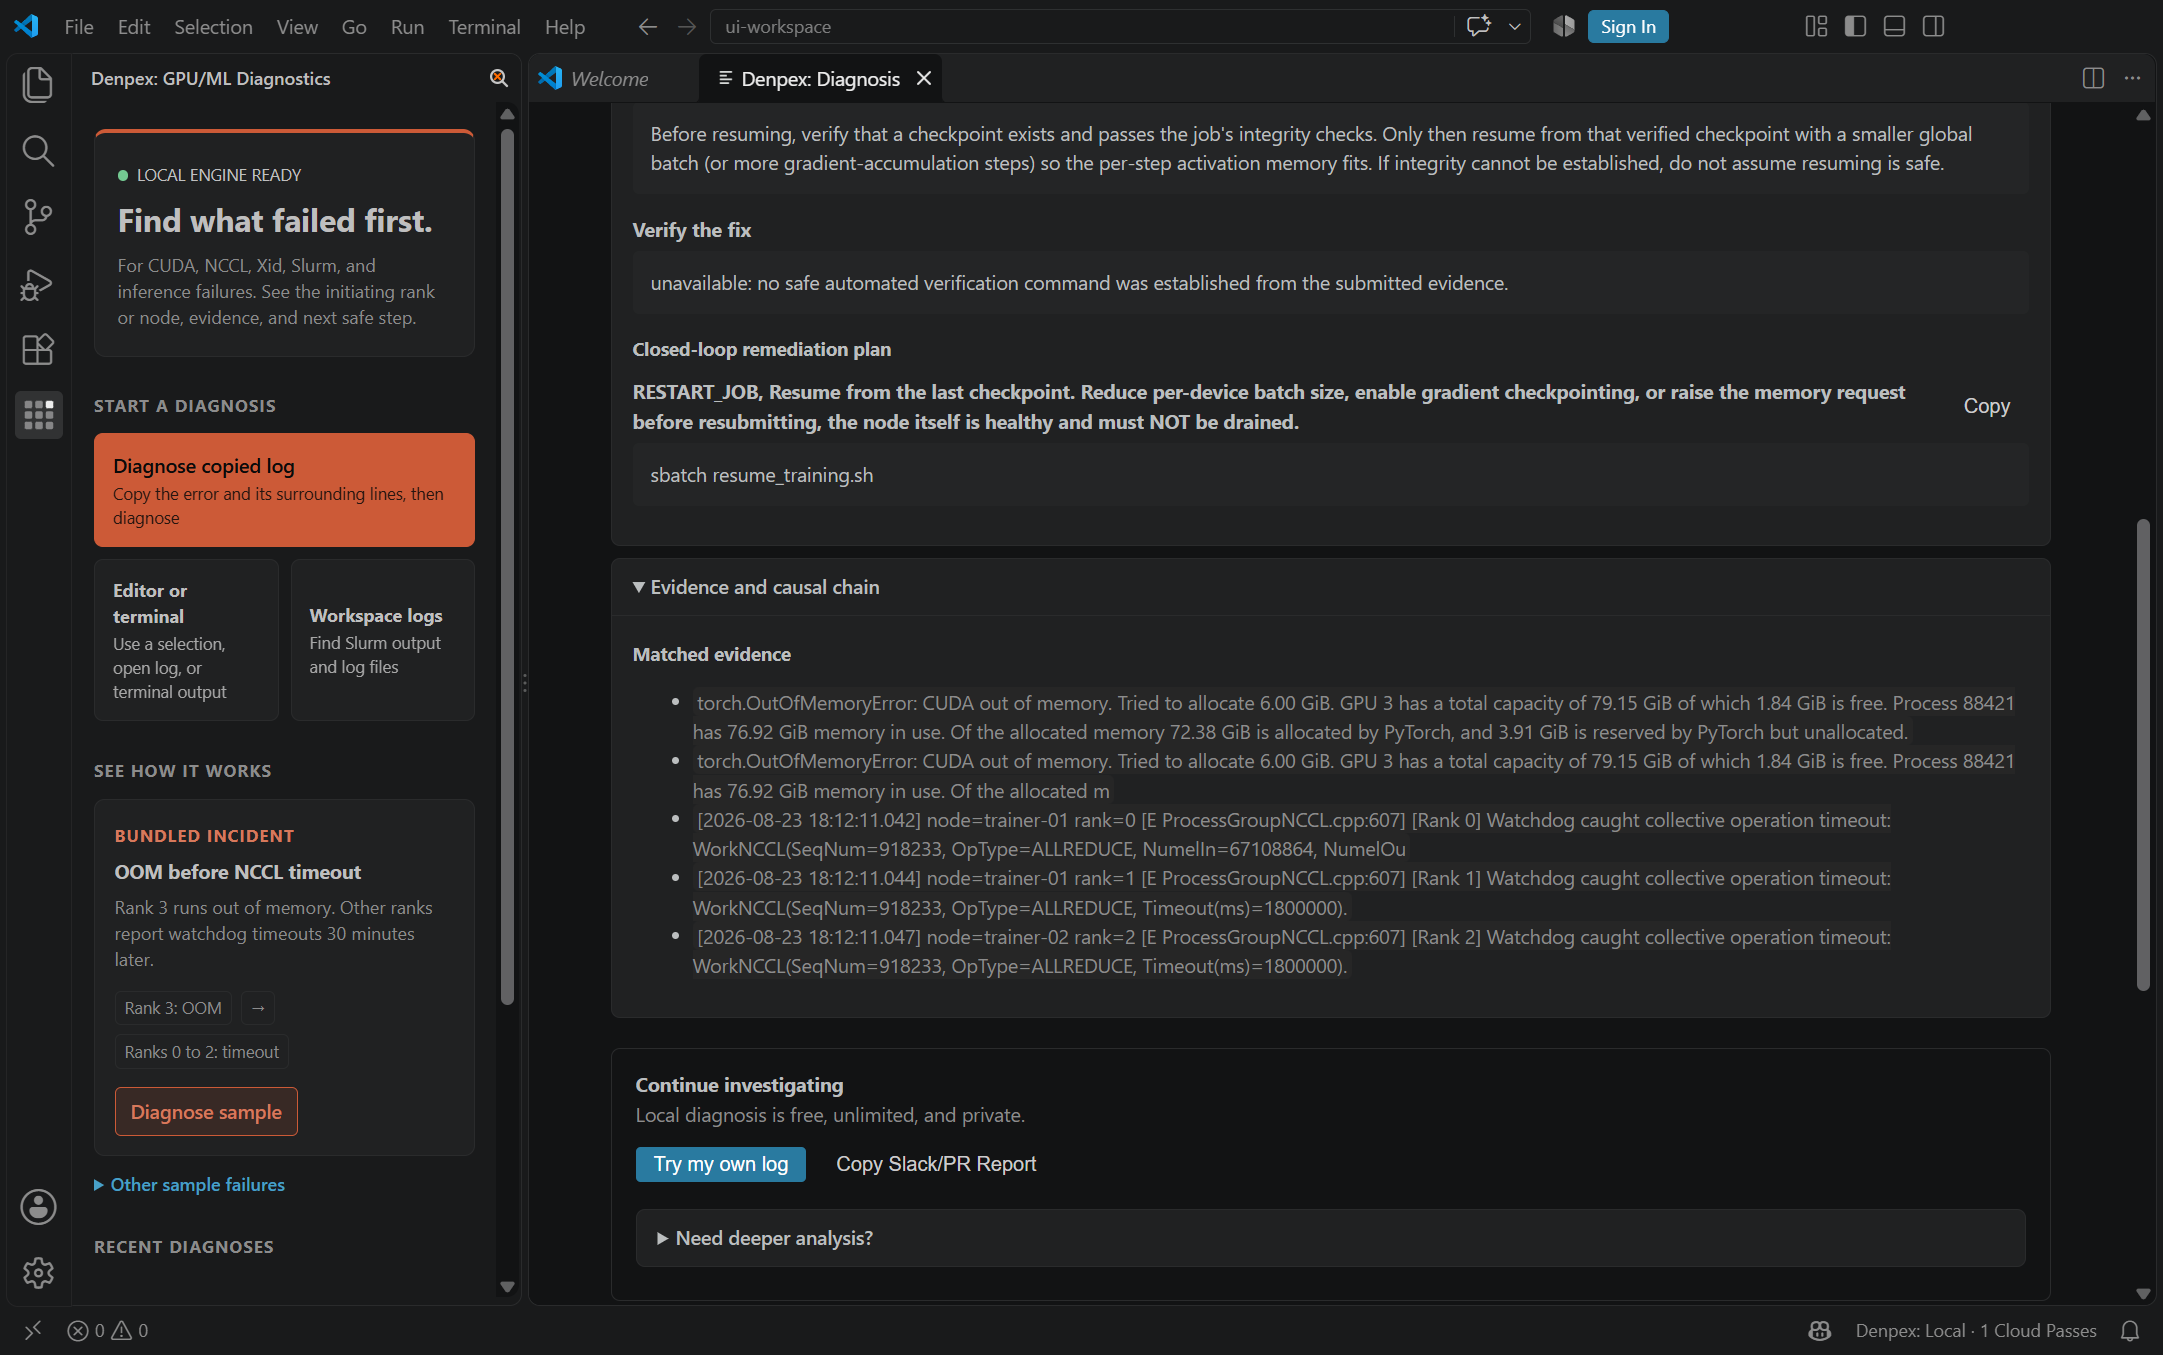
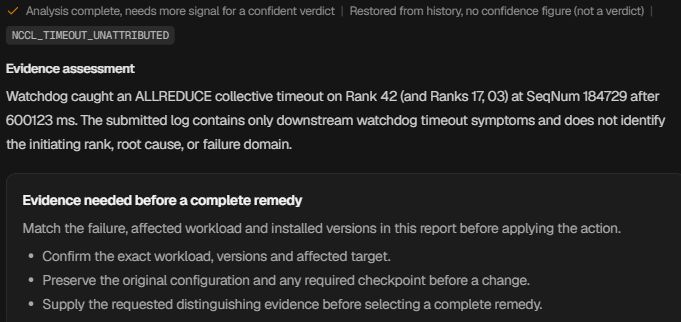
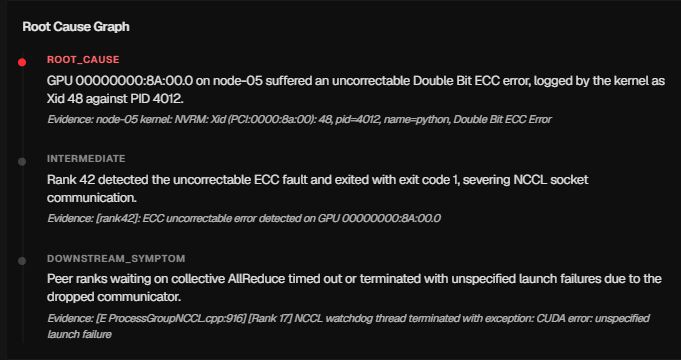
Follow the causal chain, inspect the quoted evidence and prepare the next handoff. These actual product captures use founder-account examples and the VS Code extension, with the source identified under each image. Open a capture to inspect it at full size.
Keep the investigation in the editor
Ask for the evidence that is missing
Follow the failure through the cascade
What is Prometheus / Grafana?
Prometheus is a time-series database with a pull-based scrape model and its own query language, PromQL. Grafana is the visualization and alerting layer most teams put on top of it. On a GPU cluster the usual shape is dcgm-exporter and node-exporter feeding per-device and per-host metrics into Prometheus, with Grafana dashboards for utilization, memory, temperature, power and throughput, plus Alertmanager rules for thresholds. It is the default observability stack for Kubernetes and for most self-managed GPU fleets, and it is very good at what it does.
What is Denpex?
Denpex is a failure diagnosis engine for distributed training and inference. Its input is the text a failed job produced: rank logs, tracebacks, watchdog dumps, scheduler output. It correlates those across ranks into a single timeline, classifies the failure against 16,400+ known signatures, and returns a ranked root cause with the specific evidence behind it and a concrete next action.
The core difference
Metrics and logs answer different questions, and a training failure is a log question. Prometheus stores numbers sampled on an interval, which is the right shape for 'GPU utilization on node-14 over the last six hours' and the wrong shape for 'a Python traceback on rank 233 says the process group was torn down'. The most useful artifact in a distributed crash is a string, and Prometheus is deliberately not a string store. Denpex starts where the metric ends: the dashboard tells you throughput fell at 03:14, and the diagnosis tells you rank 233 hit an uncorrectable ECC error at 03:13:58 and the other 511 ranks timed out waiting on its all-reduce.
Feature comparison
| Capability | Denpex | Prometheus / Grafana |
|---|---|---|
| Time-series metric storage and query (PromQL) | No | Yes |
| Dashboards, panels and long-range trend views | No | Yes |
| Threshold and rate-of-change alerting | On diagnosed failures | Yes |
| Fleet-wide capacity and utilization reporting | No | Yes |
| Reads unstructured logs and tracebacks | Yes | No |
| Identifies the rank that failed first | Yes | No |
| Distinguishes an initiating fault from downstream timeouts | Yes | No |
| 11,700+ failure patterns with prescriptive fixes | Yes | No |
| Explains a crash that produced no metric at all | Yes | No |
| Answers after the job is already dead and scraping stopped | Yes | Last scrape only |
| Setup before it is useful | None, paste a log | Exporters, scrape config, retention |
Verdict
Keep Prometheus and Grafana for what they are unmatched at: continuous metrics, capacity planning, trend analysis and the alert that wakes someone up. Use Denpex for the twenty minutes after that alert, when someone is staring at a dashboard that clearly shows throughput collapsing at 03:14 and still has no idea which of 512 ranks caused it. A dashboard localises a problem in time. It does not localise it in cause.
Key differences explained
A cliff on a graph is a symptom, not a cause
Every distributed failure looks identical on a Grafana panel: throughput goes to zero. Whether that was a bad NIC, a NaN loss, an OOM, a hung dataloader or a preempted node, the graph is the same shape. The information that separates them is in the logs, which is why teams end up SSHing into nodes with the dashboard still open on the other monitor. Denpex is the step that reads those logs so the shape on the graph gets a name.
Scraping stops exactly when you need it most
Prometheus pulls on an interval, typically 15 to 60 seconds. A crashing process stops answering scrapes, so the final moments before a failure are the least well sampled part of the timeline, and a node that is drained or recycled after the incident takes its remaining detail with it. Logs are written synchronously by the process itself right up to the moment it dies, which is why the causal ordering survives there and not in the metric series.
Cardinality makes per-rank metrics impractical
Labelling every metric by rank on a 4,096-GPU job is a well known way to hurt a Prometheus server, so most teams sensibly aggregate to the node or the job. That aggregation is exactly what erases the signal you need, because the initiating rank is a single series inside the average. Denpex reasons per rank without adding a single time series, because the per-rank detail is already in the logs.
Alerting on a diagnosis, not on a threshold
A threshold alert says a number crossed a line. Denpex alerts carry the classified failure, the evidence that supports it, and the recommended action, which is the difference between paging someone at 3am with 'throughput below 40%' and paging them with 'uncorrectable ECC on node-14 GPU 3, drain the node and resume from the last checkpoint'. Denpex alerts reach Slack, PagerDuty, email, SMS and generic webhooks; there is no native Prometheus or Alertmanager exporter today.
When to use each
Use Prometheus / Grafana when…
You need continuous metrics, historical trends, capacity and utilization reporting, or SLO tracking. You want dashboards for people who will never read a log. You need threshold alerting on live signals. You are answering questions about the fleet over time rather than about one incident.
Use Denpex when…
A run died and you have logs but no answer. You need the initiating rank rather than the loudest one. You want to know whether the next step is an RMA, a config change or a code fix, before spending more GPU-hours on a retry. You are triaging a failure that produced a traceback rather than a metric.
Use both when…
The normal production setup. Prometheus and Grafana detect and localise the incident in time and page the on-call. Denpex takes the logs from that window and localises it in cause. Denpex alerts can be delivered by generic webhook if you want the diagnosis to land alongside your existing alert flow.
Integration path
There is nothing to migrate and nothing to turn off. Leave your exporters, scrape configuration, retention and dashboards exactly as they are. Denpex reads logs, so the first useful step is pasting a failed run into the free diagnosis tool. If you install the agent later it wraps the training command and does not modify your scrape targets or Alertmanager routes.
Frequently asked questions
Can Prometheus tell me which rank caused a NCCL timeout?
Only if you are already exporting per-rank metrics at sufficient resolution, which most clusters avoid because of cardinality, and even then a metric shows you which rank stopped reporting rather than why. The causal ordering across ranks lives in the log timestamps and in the content of the error messages, neither of which Prometheus stores.
Should I replace Grafana with Denpex?
No. They do not overlap. Grafana is where you watch a fleet; Denpex is where you diagnose one dead job. If anything, teams use both more heavily together, because a faster diagnosis makes the dashboards more useful rather than less.
Does Denpex export metrics to Prometheus?
Not today. There is no native Prometheus exporter or Alertmanager integration. Diagnosis alerts are delivered through Slack, PagerDuty, email, SMS and generic signed webhooks, and a webhook can be pointed at a compatible receiver if you want them in the same pipeline.
We already have dcgm-exporter. What does Denpex add?
dcgm-exporter gives you the device state, which is the corroborating half of a hardware verdict. It does not read your training logs, does not know your rank topology and cannot say whether an Xid on one node explains timeouts on the other 511. Denpex supplies that reasoning and uses the DCGM signal in your logs as supporting evidence.
Our failures do not show up in metrics at all. Is that normal?
Yes, and it is the common case for the expensive ones. Silent data corruption, gradient explosion, NaN loss, deadlocked collectives and misconfigured transports frequently leave utilization and temperature looking entirely normal. Those are diagnosed from logs and from the run's own behaviour, not from device telemetry.