Denpex vs DIY log-grep pipelines
The hidden cost of 12-hour MTTR for distributed training failures.
Inside Denpex
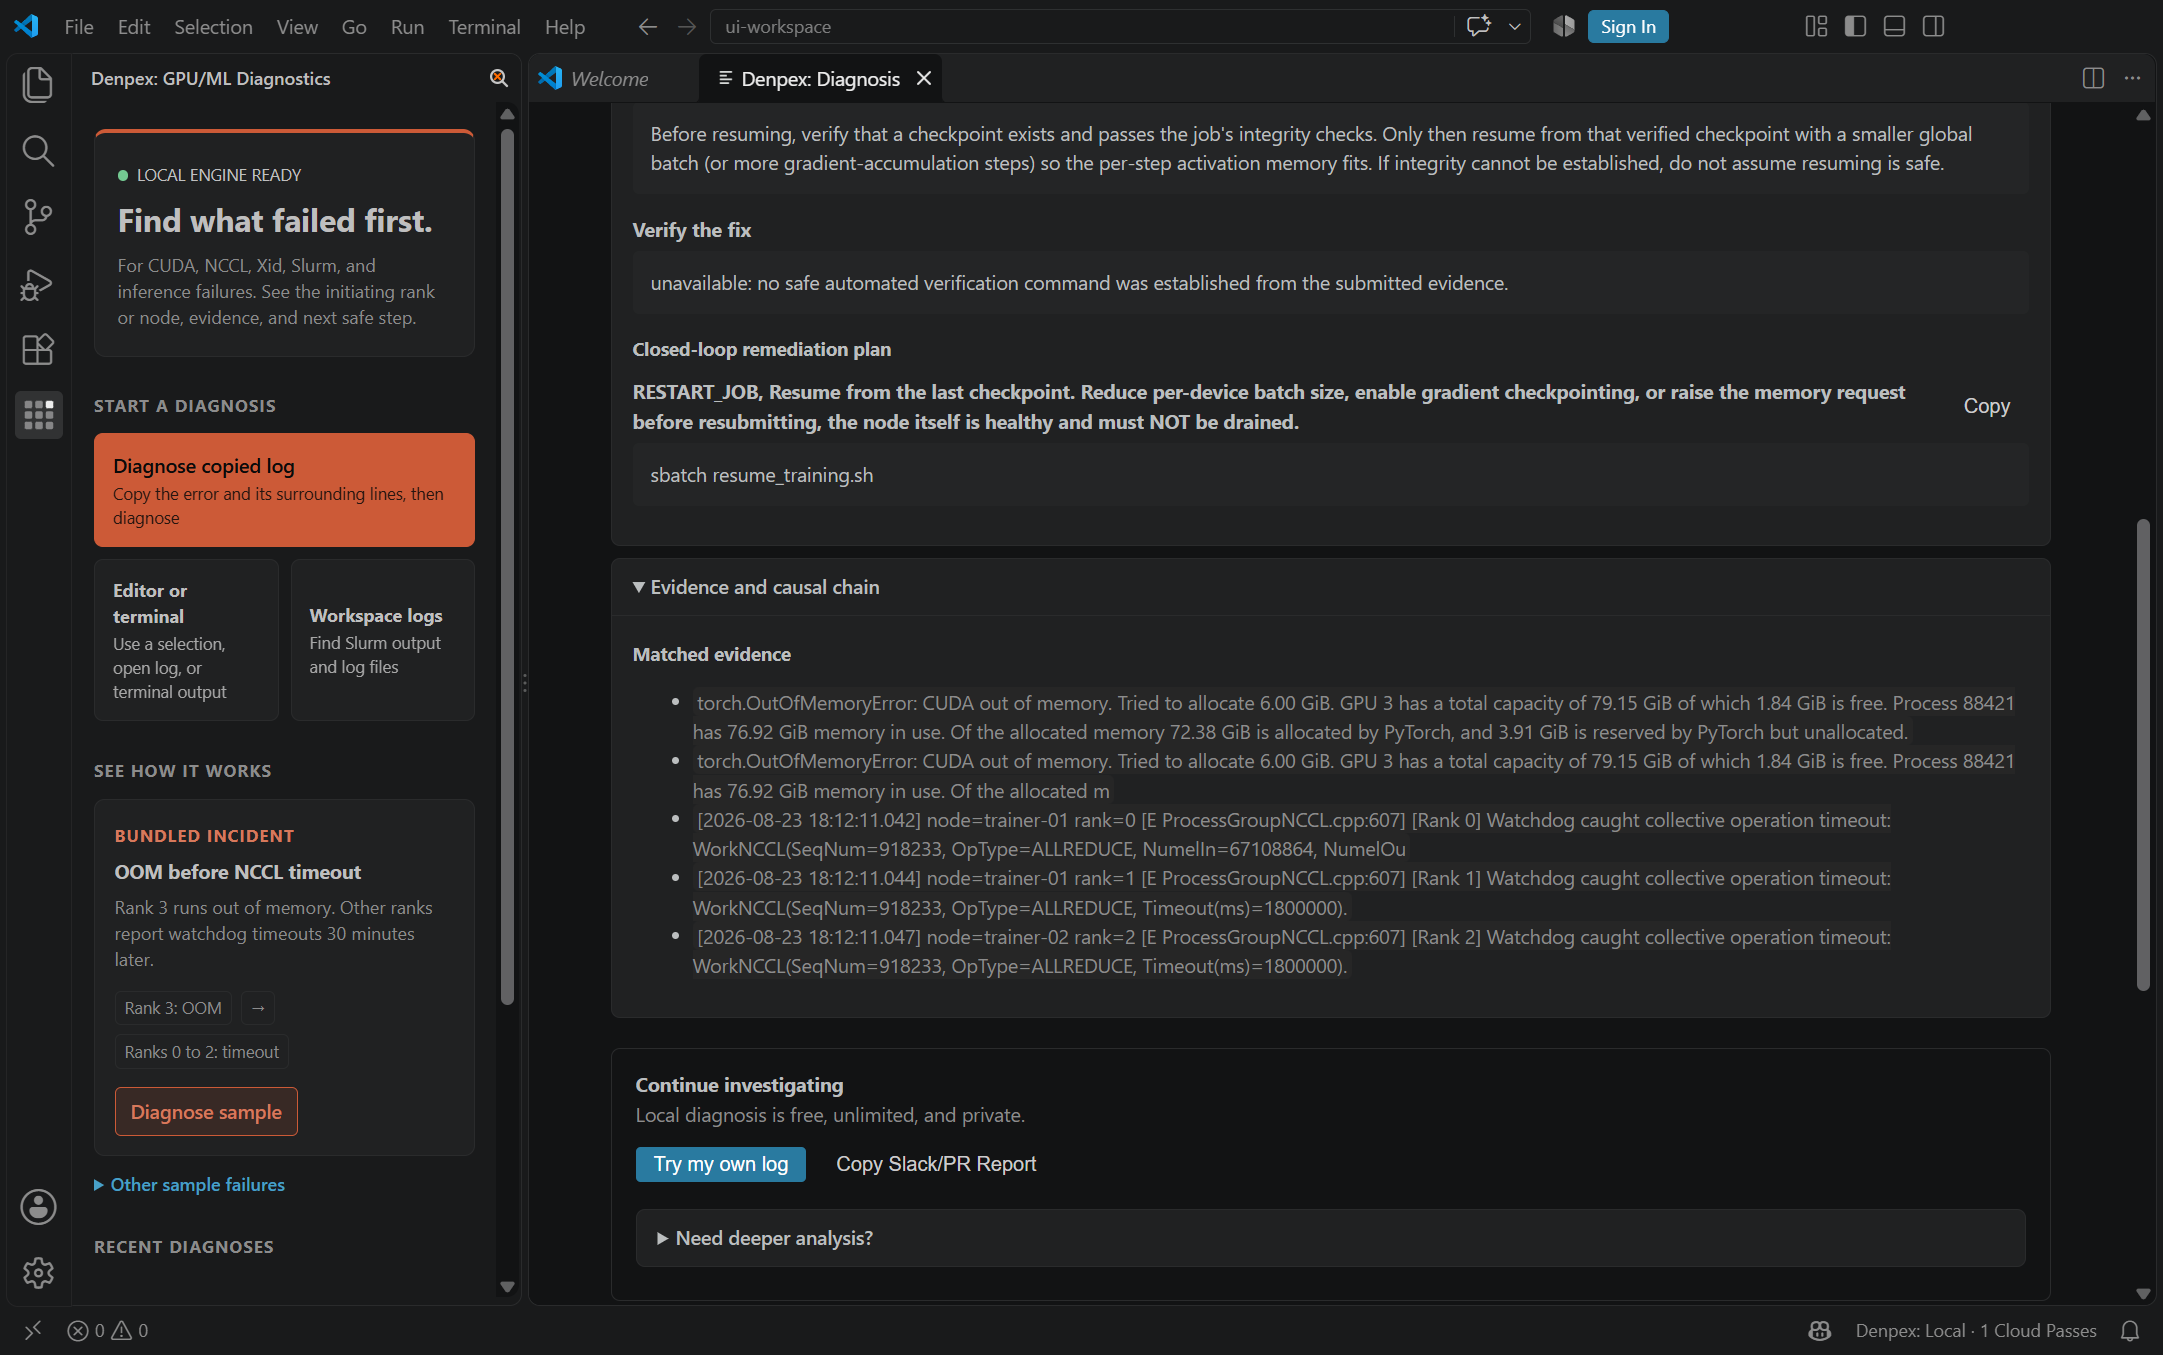
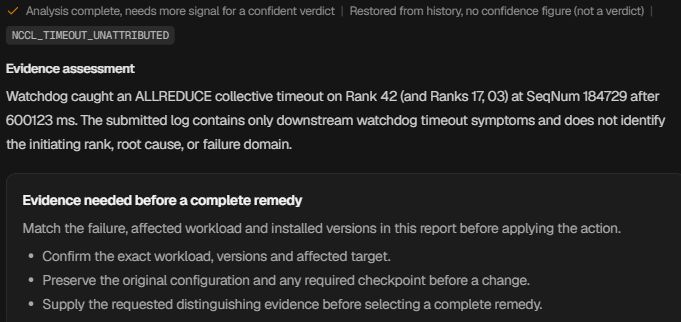
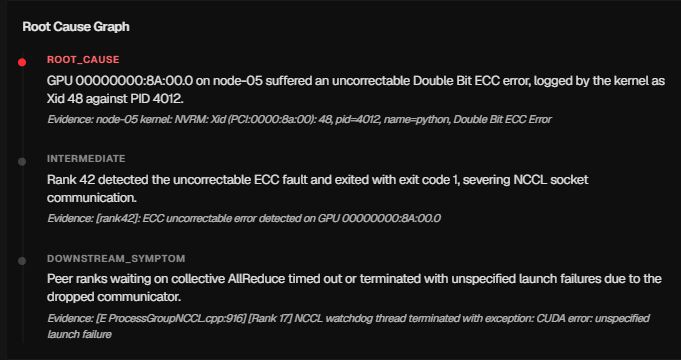
See the evidence, not just the claim
Follow the causal chain, inspect the quoted evidence and prepare the next handoff. These actual product captures use founder-account examples and the VS Code extension, with the source identified under each image. Open a capture to inspect it at full size.
Keep the investigation in the editor
Ask for the evidence that is missing
Follow the failure through the cascade
What is DIY log-grep pipelines?
A DIY failure detection pipeline is the de facto standard at most ML teams before they reach scale. It typically looks like: grep the crash logs for known error strings, post the raw log snippet to a Slack channel, and wait for whoever is on-call to investigate. Mature DIY setups add regex libraries, Splunk or ELK for log aggregation, custom dashboards, and routing rules. These systems work until the failure class library grows, PyTorch releases a new NCCL version that changes error message formats, or the engineer who wrote the regexes leaves the team.
What is Denpex?
Denpex is a purpose-built ML training failure diagnosis engine. It correlates available rank logs, applies clock-drift correction for causal ordering, classifies failures against 11,700+ documented patterns, and returns an evidence-ranked root cause and prescriptive next action. It also analyzes cross-rank cascades, SDC evidence, and straggler telemetry when those signals are available.
The core difference
The core difference is maintenance burden vs reliability. A DIY pipeline is only as good as the patterns it knows, the engineer who wrote them, and how recently it was updated against the latest framework versions. Every NCCL release, every PyTorch major version, every new GPU model can break your pattern library. Denpex maintains the pattern library, handles framework version changes, and adds new failure classes as they appear in the wild. Your team ships models instead of maintaining diagnostic infrastructure.
Feature comparison
| Capability | Denpex | DIY log-grep pipelines |
|---|---|---|
| Matches against 16,400+ failure signatures out of the box | Yes | Engineer writes the regex per class |
| Cross-rank cascade analysis (clock-drift corrected) | Yes | Build it yourself in Splunk / ELK |
| Classifies failures as hardware / ML / data / environment | Yes | No |
| Prescriptive fixes: env var, config, or resume command | Yes | Engineer pastes the fix in Slack |
| Silent data corruption (SDC) detection | Yes | No |
| Straggler and gray-failure detection | Yes | No |
| Per-layer weight-delta anomaly detection | Yes | No |
| Routes alert to the right engineer with fix inline | Yes | On-call writes routing rules |
| Updated against PyTorch / CUDA / NCCL / cuDNN releases | Yes | Engineer maintains the patterns |
| Self-hosted (in-VPC) option | Yes | Already self-hosted |
| Time-to-first-diagnosis | Fast deterministic path; deeper path for ambiguous failures | Depends on on-call investigation |
| Cost | From $0; Team $415/month billed annually ($499 month-to-month) through Data Center $12,500/month billed annually ($15,000 month-to-month) | 1 senior engineer (~$1,200/wk) keeping it working |
Verdict
A custom Slack-bot and grep pipeline works fine for 5 failure classes. By the time you have11,700+ patterns, clock-drift-corrected cross-rank analysis, and SDC detection, you're paying a senior engineer to maintain a product. Denpex Team is $415/month billed annually ($499 month-to-month) and provides a reproducible, evidence-ranked diagnostic workflow.
Key differences explained
The pattern library problem
DIY pipelines typically start with 5 to 10 grep patterns for the most common failures. After 2 to 3 years, a mature team's library has 50 to 200 patterns, but coverage is still spotty. The patterns were written reactively, after failures were already experienced. Denpex ships with 11,700+ curated patterns built from real distributed training incidents across NCCL, CUDA, PyTorch, DeepSpeed, FSDP, Megatron-LM, and major GPU hardware, plus 4,700+ resolved real-world incidents. Coverage is proactive, not reactive.
Cross-rank causality is genuinely hard to build
The hardest part of a DIY failure pipeline isn't writing the patterns. It's building correct cross-rank causal ordering. When a 64-GPU job fails, each rank has its own clock. The timestamps in each rank's logs can diverge by hundreds of milliseconds. Without clock-drift correction, your causal ordering is wrong and you identify the wrong originating rank. Denpex solves this at collection time using a distributed timestamp correction protocol. Building this correctly in-house typically takes 2 to 3 months of a senior engineer's time.
Maintenance compounds over time
DIY pipelines accrue technical debt on two axes: the pattern library must be updated whenever frameworks change their error formats (NCCL has changed its timeout message format 3 times in the last 4 PyTorch major releases), and the routing rules must be updated whenever team structure changes. Denpex maintains the pattern library continuously and routing is configured through the dashboard, not code. The total ownership cost of a mature DIY system, measured in senior engineering time, typically exceeds $1,200/week.
Silent failures that grep cannot catch
Grep-based detection only catches failures that produce log output. Silent data corruption, gray failures, and stragglers produce no error messages. They just show up as training being slow or are discovered at evaluation time weeks later. Denpex monitors the hardware telemetry stream (DCGM/NVML) and per-layer weight-delta distributions to detect these failure modes before they compound into wasted GPU weeks.
When to use each
Use DIY log-grep pipelines when…
Your team has fewer than 10 distinct failure classes. Your cluster is homogeneous and small (fewer than 32 GPUs). You have an engineer whose explicit job is to maintain the diagnostic pipeline. You have compliance requirements that prevent any data from leaving your VPC, even anonymized metadata.
Use Denpex when…
Your team experiences multiple failure classes, runs distributed training at 32+ GPUs, and wants to reduce manual evidence correlation and maintenance of diagnostic infrastructure. You also need analysis of SDC and gray-failure telemetry that a grep-only pipeline cannot provide.
Use both when…
Teams using Denpex in-VPC mode (Scale+) effectively run both. The Denpex engine runs locally inside your infrastructure and your existing log forwarding pipeline continues to operate alongside it. There is no conflict.
Integration path
Migration from a DIY pipeline to Denpex is typically completed in an afternoon. Install the Denpex agent (one pip install and a wrapper around your training command), configure the Slack or PagerDuty alert destination, and run a test diagnosis. Your existing grep scripts and Slack channels can stay in place during the transition. Denpex runs in parallel. Once you've confirmed the quality of Denpex diagnoses on a few real failures, you can deprecate the manual pipeline on your own timeline.
Frequently asked questions
We've been building our DIY pipeline for years. Is it worth switching?
The answer depends on maintenance cost vs coverage. If a senior engineer is spending more than a few hours per month maintaining your pattern library and routing rules, Denpex is almost certainly cheaper, and covers 16,400+ signatures immediately instead of the subset you've accumulated. The incremental coverage for failure classes you haven't seen yet is often the deciding factor.
Our DIY pipeline catches everything we care about. Why change?
It catches everything that produces a log message you've written a pattern for. Silent data corruption, gray failures, and stragglers produce no log output. If you've never detected one, it may be because you've never had a tool that could detect them. They just haven't had a tool that could detect them.
Can Denpex run inside our VPC with no external calls?
Yes. The Scale+ plan includes in-VPC deployment. The Denpex engine runs locally with no external API calls. The on-host bundle includes 721 encyclopedia entries and 10989 regex signatures, deterministically and without egress. LLM fallback for novel failures is the only cloud-dependent feature and can be disabled.
What happens when a new PyTorch version changes NCCL error formats?
Denpex maintains regression tests and version-advisory coverage for documented framework and runtime changes. No vendor release can be assumed covered until it is tested, so new semantic variations are added to the evaluation corpus instead of relying on one error string. With a DIY pipeline, a format change can silently break a grep rule until someone notices.
Can Denpex integrate with our existing Slack alert channel?
Yes. Denpex can forward alerts to any Slack channel, PagerDuty incident, webhook endpoint, or email address. The alert includes the failure class, originating rank, severity, and prescriptive fix, formatted in Markdown for Slack rendering.
We have custom failure classes specific to our cluster. Can Denpex handle them?
Yes. Confirm a fix once and it is stored in your team's knowledge base against that failure class; every later diagnosis of that class, for anyone on your team, leads with your fix rather than the generic one. You can also write entries by hand, and Data Center adds bulk custom-KB ingestion. Entries are retained between releases. If a failure class recurs on your cluster, send it in and we will add a deterministic pattern for it too.
What is the actual time-to-diagnosis for a typical NCCL timeout?
Known signatures use the fast deterministic path. Novel or ambiguous failures use a deeper path that can take several minutes and is bounded by the API's 290-second server window. Measure both paths against your own logs during evaluation.
What if the diagnosis is wrong?
Denpex diagnoses return a confidence score. Low-confidence results are surfaced with a note to verify. You can submit corrections from the dashboard. Corrections improve the model for your cluster specifically and are optionally shared back to the pattern library.